age1_list <- c(18:100)
age2_list <- c(18:100)
combinations <- expand.grid(age1 = age1_list, age2 = age2_list)
couple_df <- combinations %>%
mutate(meet_rule = case_when(
check_couple(age1, age2) == FALSE ~ "No",
check_couple(age1, age2) == TRUE ~ "Yes"
))
ggplot(couple_df, aes(x = age1, y = age2, color = meet_rule)) +
geom_point(alpha = 0.5) +
scale_color_manual(values = c("Yes" = "darkgreen", "No" = "red")) +
labs(
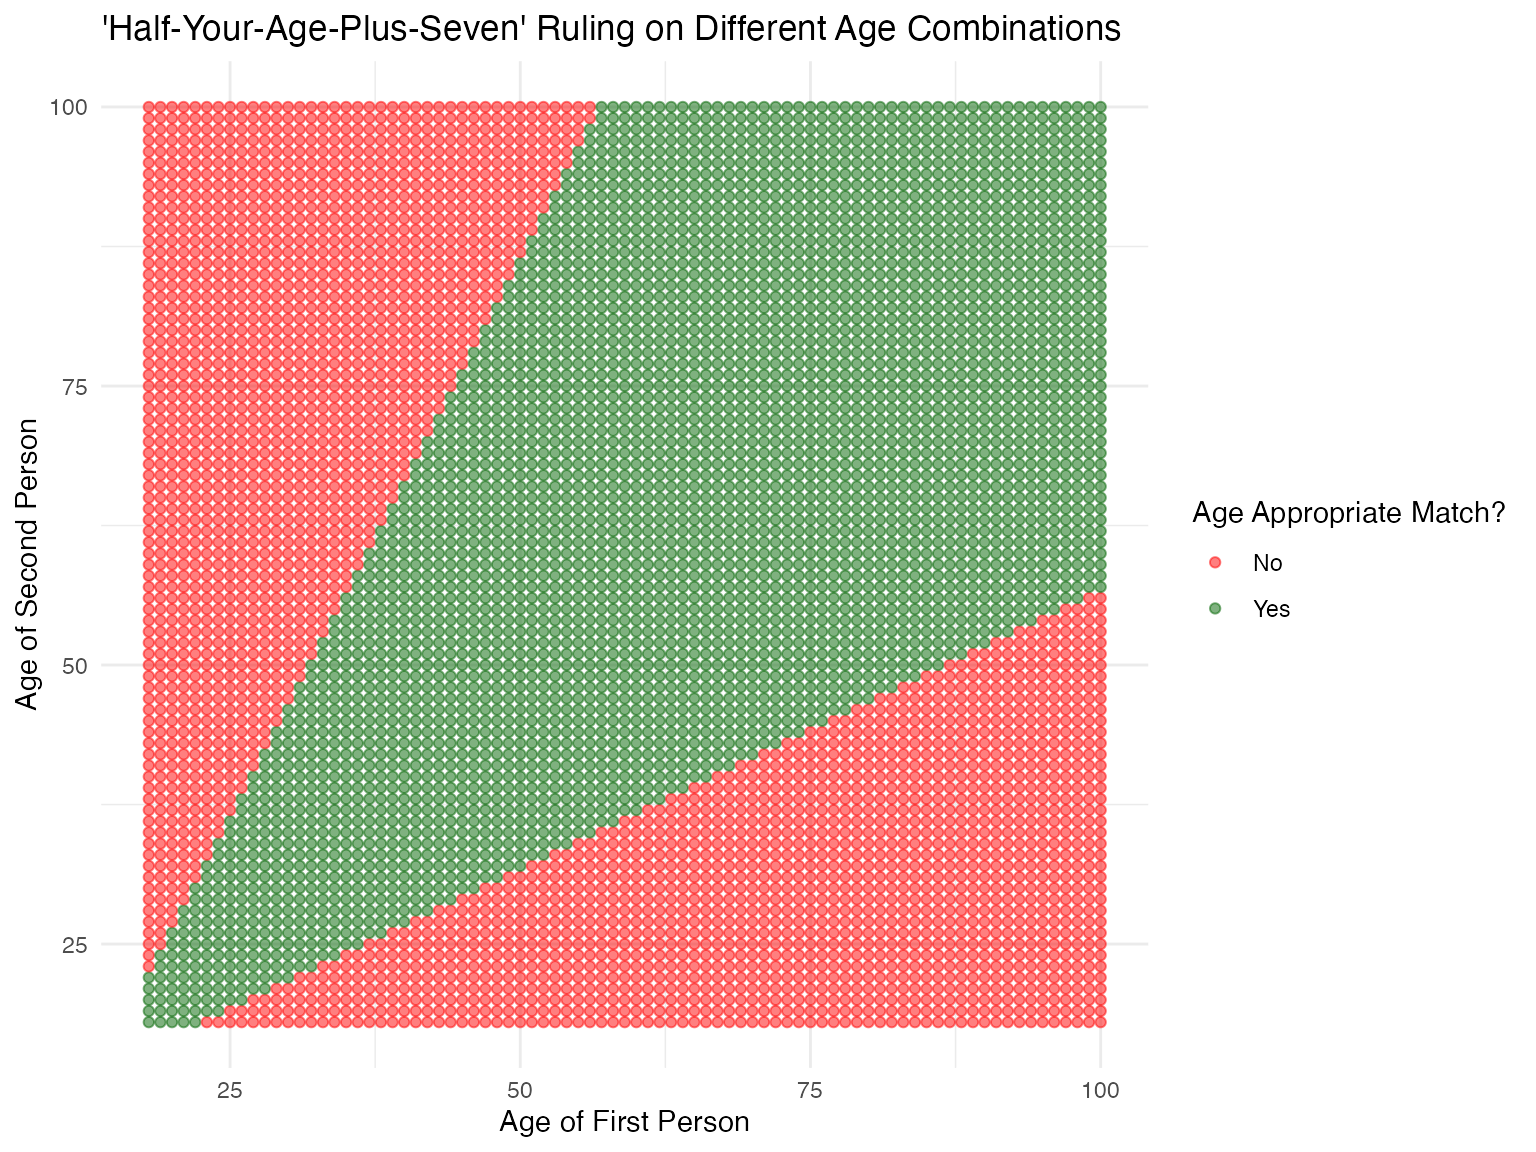
title = "'Half-Your-Age-Plus-Seven' Ruling on Different Age Combinations",
x = "Age of First Person",
y = "Age of Second Person",
color = "Age Appropriate Match?"
) +
theme_minimal()