Research Question
I am interested in exploring the characteristics of age gaps in
Hollywood movie couples and how these characteristics differ across
gender. Through exploring these questions, I will demonstrate a few of
the functions in the halfplus7 package.
I downloaded these data from the TidyTuesday GitHub. This link includes the data dictionary.
Preparing for Analysis
Saving the Data
download_and_save <- function(file_name, url) {
  data_folder <- "../data"
  file_path <- file.path("../data", file_name)
  # See if the file already exists
  if (!file.exists("../data")) {
    dir.create("../data", recursive = TRUE)
  }
  if (!file.exists(file_path)) {
    # Download the data if it does not exist
    data <- readr::read_csv(url)
    # Saves the data to the path with the desired name
    write.csv(data, file = file_path, row.names = FALSE)
  }
}

# Uses download_and_save function with age_gaps.csv from GitHub
download_and_save("age_gaps.csv", 'https://raw.githubusercontent.com/rfordatascience/tidytuesday/master/data/2023/2023-02-14/age_gaps.csv')
Loading Dataset
# Imports raw age_gap dataset
age_gaps_raw <- read_csv("../data/age_gaps.csv")
Cleaning Dataset
age_gaps_v1 <- age_gaps_raw %>%
  # creates new variable to describe sexual orientation of couple
  mutate(orientation = ifelse(character_1_gender == "man" & character_2_gender == "man" |
                               character_1_gender == "woman" & character_2_gender == "woman",
                             "LGBTQ",
                             "Straight"),
         # modifies birthdate variables to be treated as dates
         actor_1_birthdate = ymd(actor_1_birthdate),
         actor_2_birthdate = ymd(actor_2_birthdate))

#calculates the older actor in the couple
calculate_older_actor <- function(man_birthdate, woman_birthdate) {
  if (man_birthdate < woman_birthdate) {
    return("man")
  } else if (woman_birthdate < man_birthdate) {
    return("woman")
  } else {
    return("same birthdate")
  }
}

assign_gender_details <- function(character_1_gender, character_2_gender, actor_1_age, actor_1_birthdate, actor_1_name, actor_2_age, actor_2_birthdate, actor_2_name) {
  details <- list()

  if (character_1_gender == "man") {
    details$man_age <- actor_1_age
    details$man_birthdate <- ymd(actor_1_birthdate)
    details$man_name <- actor_1_name
  } else {
    details$man_age <- actor_2_age
    details$man_birthdate <- ymd(actor_2_birthdate)
    details$man_name <- actor_2_name
  }

  if (character_2_gender == "woman") {
    details$woman_age <- actor_2_age
    details$woman_birthdate <- actor_2_birthdate
    details$woman_name <- actor_2_name
  } else {
    details$woman_age <- actor_1_age
    details$woman_birthdate <- actor_1_birthdate
    details$woman_name <- actor_1_name
  }

  return(details)
}

age_gaps_straight <- age_gaps_v1 %>%
  filter(orientation == "Straight") %>%
  mutate(
    details = pmap(list(character_1_gender, character_2_gender, actor_1_age, actor_1_birthdate, actor_1_name, actor_2_age, actor_2_birthdate, actor_2_name), assign_gender_details)
  ) %>%
  # Unpack the details
  mutate(
    man_age = map_dbl(details, "man_age"),
    man_birthdate = map(details, "man_birthdate") %>% map_chr(as.character) %>% ymd(),
    man_name = map_chr(details, "man_name"),
    woman_age = map_dbl(details, "woman_age"),
    woman_birthdate = map(details, "woman_birthdate") %>% map_chr(as.character) %>% ymd(),
    woman_name = map_chr(details, "woman_name"),
    older_actor = pmap_chr(list(man_birthdate, woman_birthdate), calculate_older_actor)
  ) %>%
  select(-details)
Age Gaps over Time
In more recent years, there is a larger volume of movie couples. Overall, there are more straight couples where the man is older than where the woman is older.
ggplot(age_gaps_straight, aes(x = release_year, y = age_difference, color = older_actor)) +
  # adds jitter for discrete data
  geom_jitter(alpha = 0.5) +
  # designates color of points by gender of older actor in couple
  scale_color_manual(values = c("man" = "darkgreen", "woman" = "purple"),
    labels = c("Man", "Woman")) +
  # creates labels for plot
  labs(
    title = "Movie Couple Age Differences Over Time",
    subtitle = "This visualization includes straight couples from movies over time.",
    x = "Year",
    y = "Age Difference",
    color = "Gender of Older \nActor in Couple:",
    caption = "Created using Tidy Tuesday Data"
  ) +
  theme_minimal()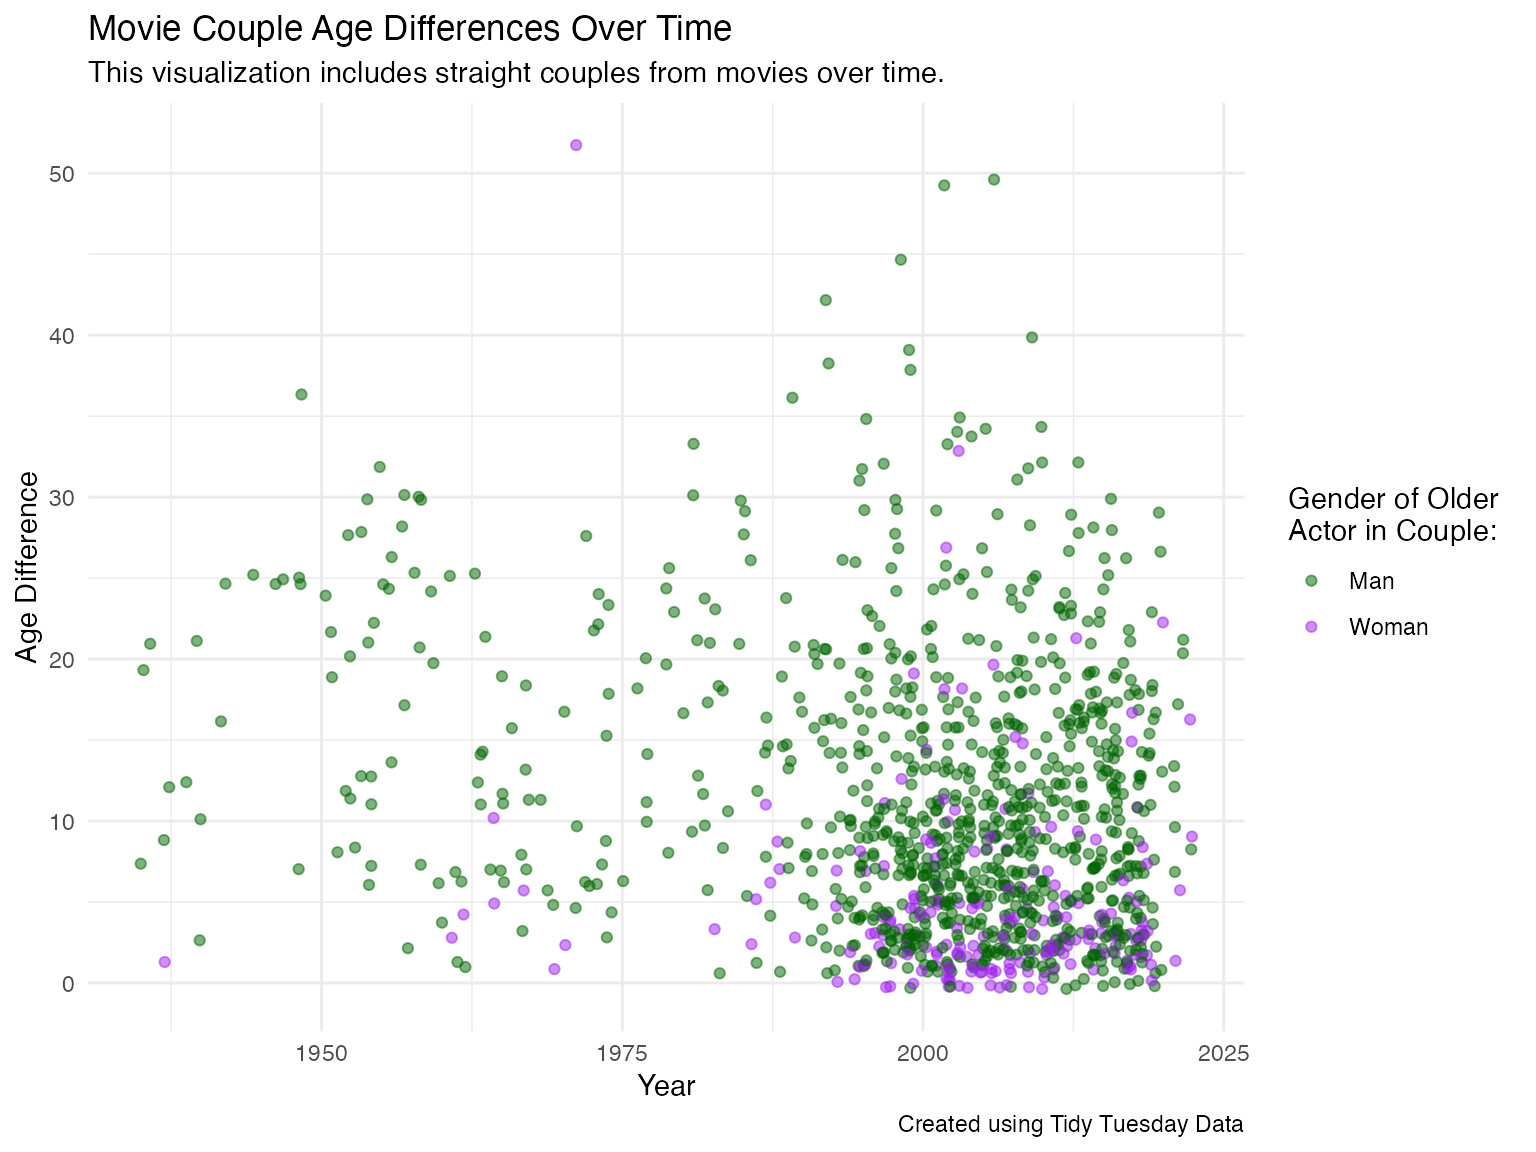
Overall, there appears to be more straight couples with an older man that do not meet the “Half-Your-Age-Plus-7” Rule.
Please note that this plot includes a demonstration of the
check_couple function
age_gaps_straight %>%
  mutate(match_rule = case_when(
    check_couple(man_age, woman_age) == FALSE ~ "No",
    check_couple(man_age, woman_age) == TRUE ~ "Yes")) %>%
ggplot(aes(x = release_year, y = age_difference, color = match_rule)) +
  # adds jitter for discrete data
  geom_jitter(alpha = 0.5) +
  # designates color of points by gender of older actor in couple
  scale_color_manual(values = c("Yes" = "blue", "No" = "red")) +
  # creates labels for plot
  labs(
    title = "Movie Couple Age Differences Over Time",
    subtitle = "The visualization is faceted by gender of the older member of the couple.",
    x = "Year",
    y = "Age Difference",
    color = "Does the Couple follow the \n'Half-Your-Age-Plus-Seven' Rule?",
    caption = "Created using Tidy Tuesday Data"
  ) +
  theme_minimal() +
  facet_wrap(~older_actor) +
  # moves legend to top of plot
  theme(legend.position = "top")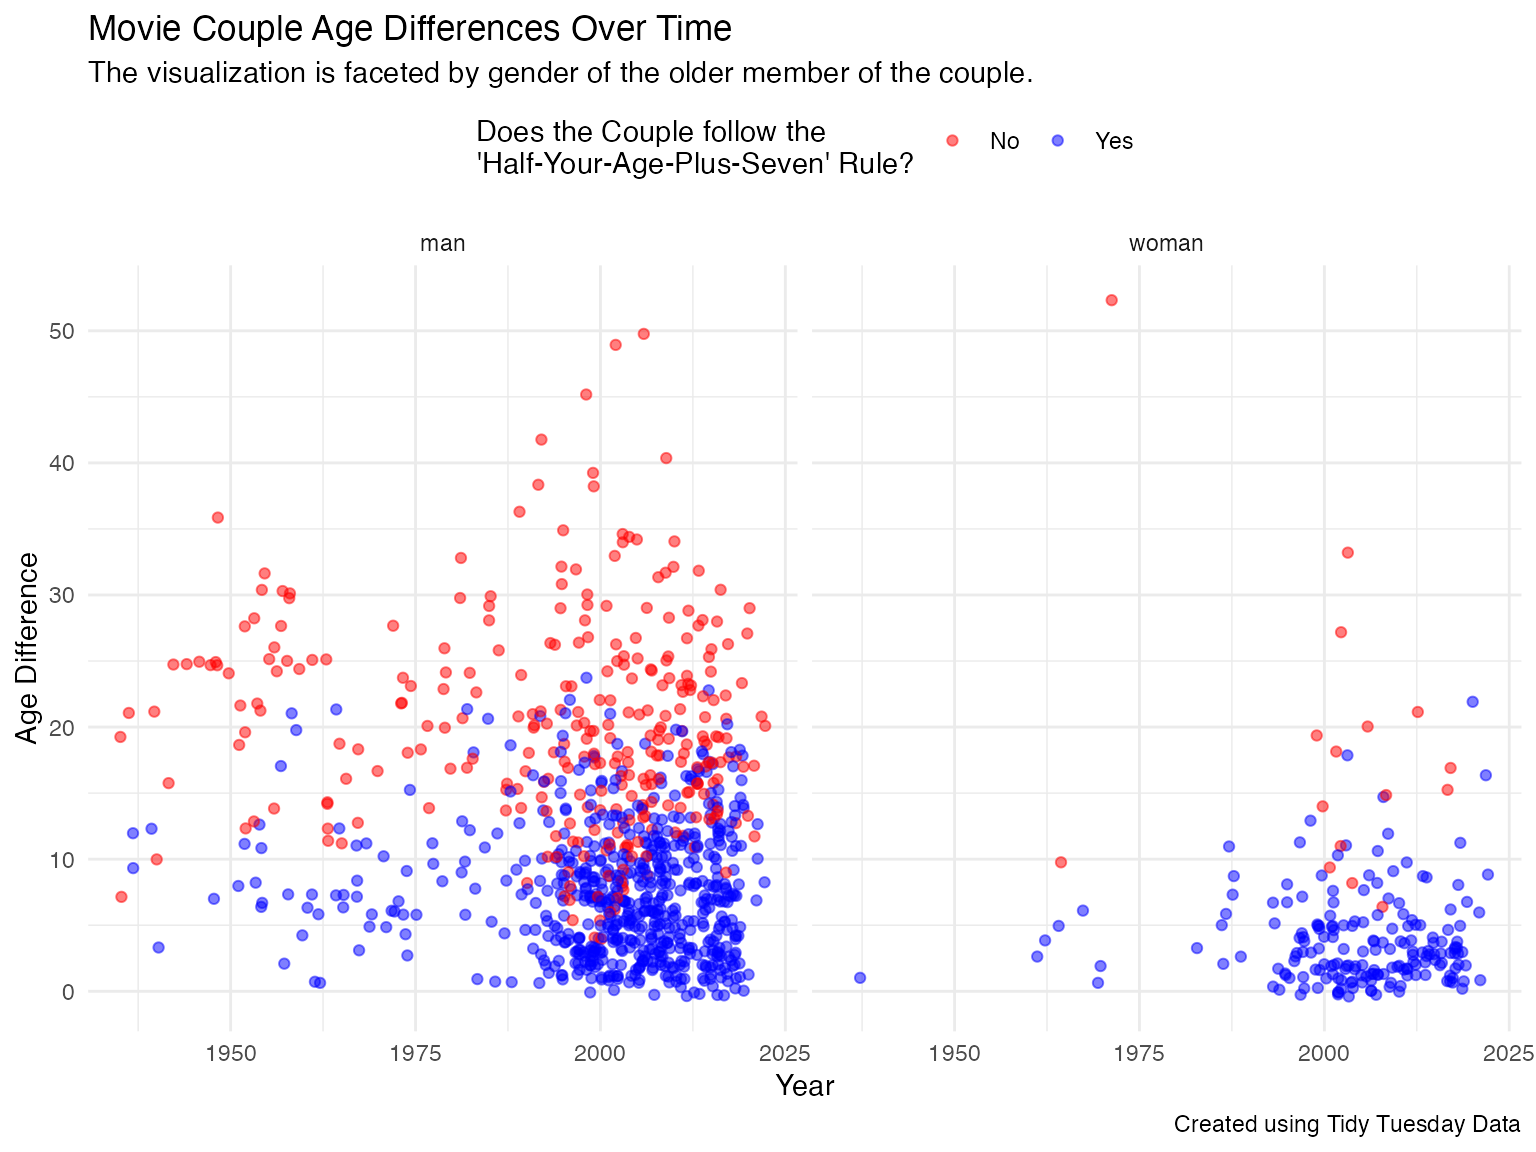
Age Comparison of Men and Women in Movie Couples
Visualized another way, there are more couples where the man is older than the woman.
Please note that the plot includes a demonstration of the
check_couple function
age_gaps_straight %>%
  # demonstrates check_couple function from halfplus7 package
  mutate(match_rule = case_when(
    check_couple(man_age, woman_age) == FALSE ~ "No",
    check_couple(man_age, woman_age) == TRUE ~ "Yes")) %>%
  ggplot(aes(man_age, woman_age, color = match_rule)) +
  # adds jitter for discrete data
  geom_jitter(alpha = 0.5) +
  # adds line at y = x to illustrate couples with the same age
  geom_abline(intercept = 0, slope = 1, linetype = "dashed", color = "black") +
  # designates colors to identify whether couple meets 'Half-Your-Age-Plus-7' Rule
  scale_color_manual(values = c("Yes" = "blue", "No" = "red")) +
  theme_minimal() +
  # adds labels for plot
  labs(
    title = "Age Comparison of Woman and Man in Straight Movie Couples",
    subtitle = "Observations that fall on the black dashed line indicate the same age for the \nman and woman.",
    x = "Man's Age",
    y = "Woman's Age",
    color = "Does the Couple follow the \n'Half-Your-Age-Plus-Seven' Rule?",
    caption = "Created using Tidy Tuesday Data"
  ) +
  # moves legend to top of plot
  theme(legend.position = "top")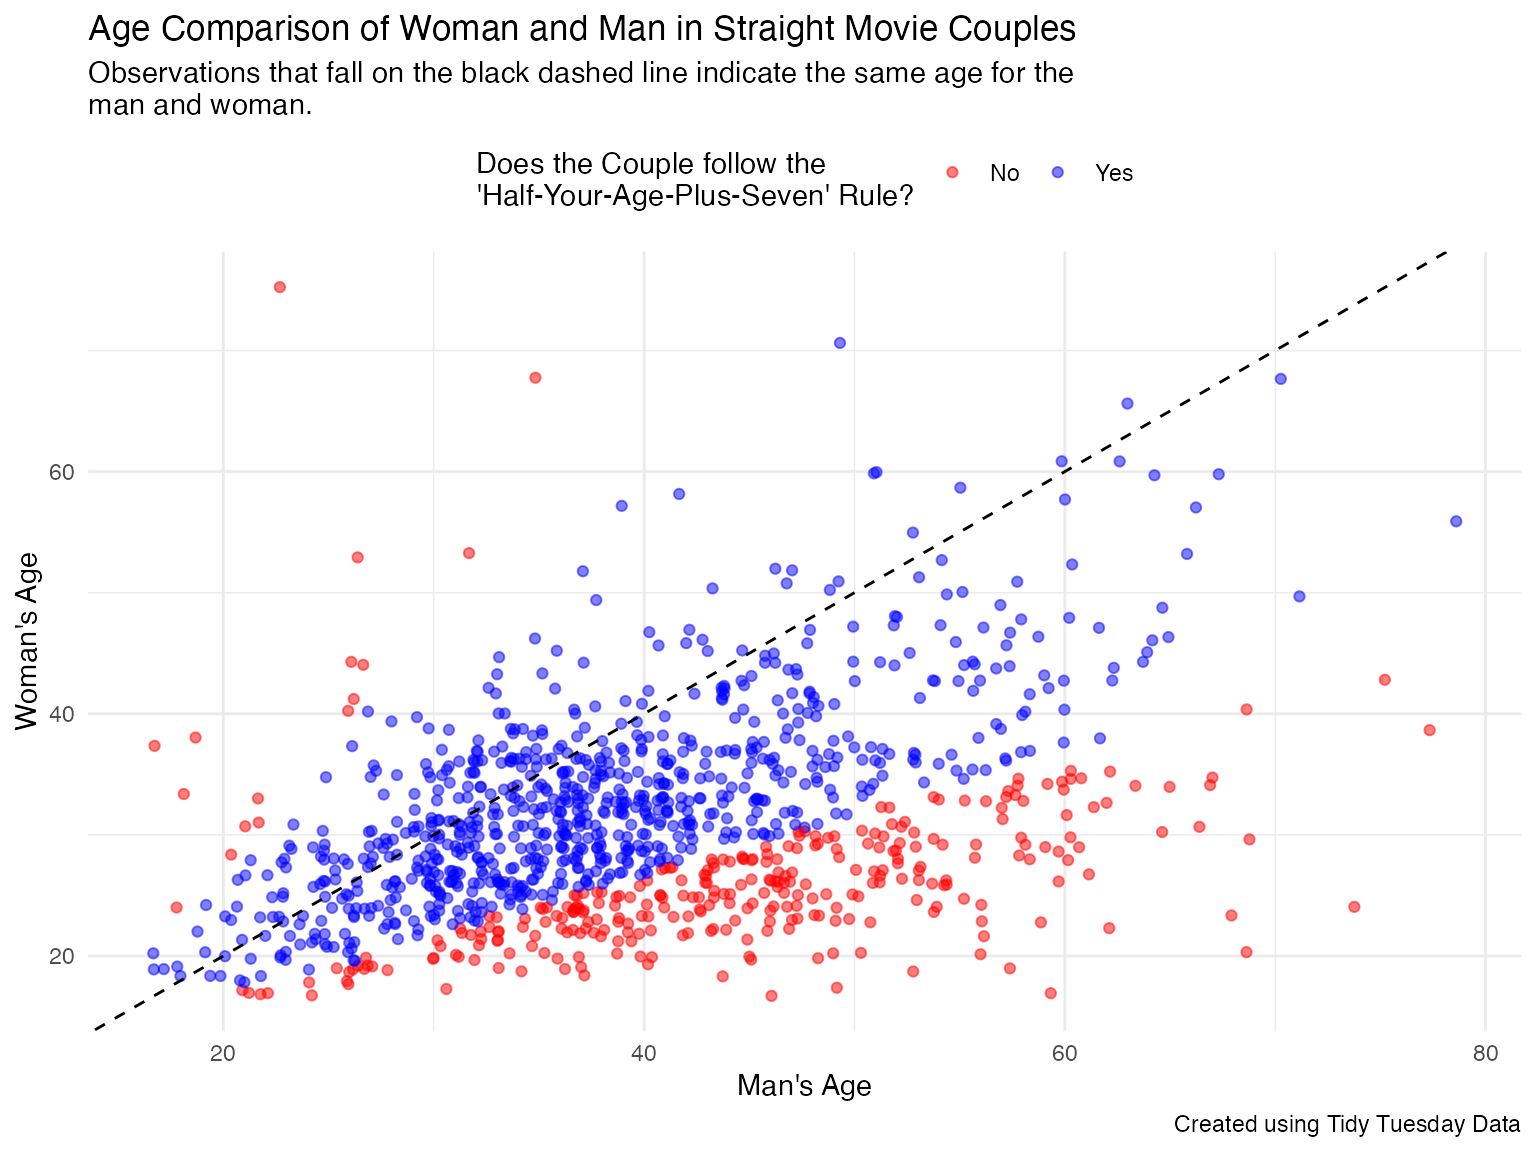
Couples with the Largest Age Gaps
Please note that the following plots include demonstrations of
the upper_limit and lower_limit
functions
# creates data set with couples with largest age gaps, 10 with older man and 10 with older woman
top_age_gaps <- age_gaps_straight %>%
  arrange(desc(age_difference)) %>%
  group_by(older_actor) %>%
  slice_head(n = 10)

# modifies dataset above
top_age_gaps_long <- top_age_gaps %>%
  uncount(weight = 1) %>%
  pivot_longer(cols = c(man_age, woman_age),
               names_to = "actor",
               values_to = "age") %>%
  mutate(actor_name = ifelse(actor == "man_age", man_name, woman_name),
         age_lowerlim = lower_limit(age),
         age_upperlim = upper_limit(age))
Top 10 Largest Age Gaps when Man is Older
In the ten largest age gaps when the man is older, none of women are within the lower age limit produced by the “Half-Your-Age-Plus-7” Rule.
top_age_gaps_long %>%
  filter(older_actor == "man") %>%
  ggplot(aes(x = age, y = reorder(movie_name, age_difference))) +
  geom_segment(aes(x = age, xend = ifelse(actor == "man_age", age_lowerlim, age),
                   y = movie_name, yend = movie_name),
               color = "lightgreen", alpha = 0.25, linetype = "solid", size = 5) +
  geom_text(data = . %>% filter(actor == "man_age"),
            aes(label = paste("lower limit =", age_lowerlim), x = age_lowerlim, y = movie_name),
            vjust = 0, hjust = 0, size = 2.5, color = "darkgreen") +
  geom_segment(aes(x = age, xend = ifelse(actor == "woman_age", age + age_difference, age),
                   y = movie_name, yend = movie_name),
               color = "gray", linetype = "dashed", linewidth = 0.5) +
    geom_label(aes(label = age, color = actor), show.legend = FALSE,
             fill = "white", size = 3, hjust = 0.5, vjust = 0.5) +
    geom_text(aes(label = actor_name, y = movie_name),
            vjust = -1.3, hjust = 0.5, size = 3) +
  labs(title = "Top 10 Largest Age Gaps in Straight Movie Couples \nWhen the Man is Older",
       subtitle = "Green shaded segments illustrate the lower age range for older actors, \ngiven the 'Half-Your-Age-Plus-7' Rule. If the younger actor's age is not \nincluded in this range that indicates that the couple would not meet the \nRule.",
       x = "Actor Age (years)",
       y = "Movie Title",
       color = "Gender:",
       caption = "Created using TidyTuesday data") +
  scale_color_manual(values = c("man_age" = "darkgreen", "woman_age" = "purple"),
    labels = c("Man", "Woman")) +
  theme_minimal() +
  theme(legend.position = "top") +
  xlim(c(12, 80))
#> Warning: Using `size` aesthetic for lines was deprecated in ggplot2 3.4.0.
#> ℹ Please use `linewidth` instead.
#> This warning is displayed once every 8 hours.
#> Call `lifecycle::last_lifecycle_warnings()` to see where this warning was
#> generated.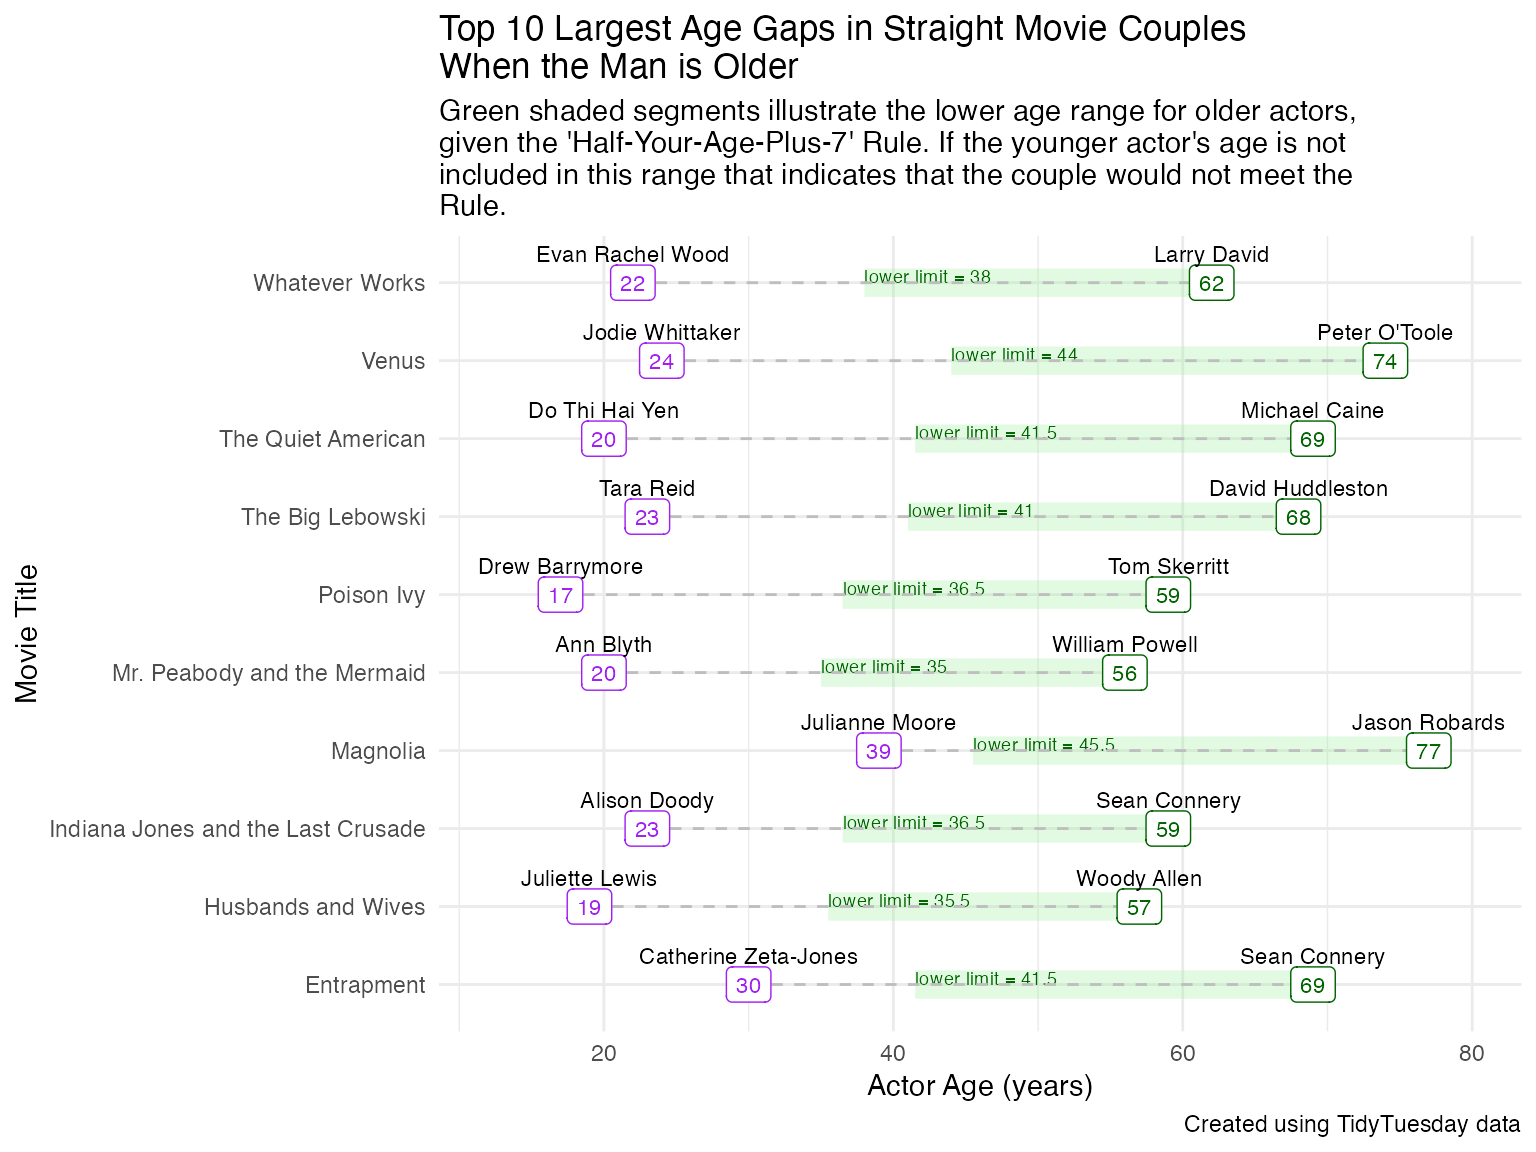
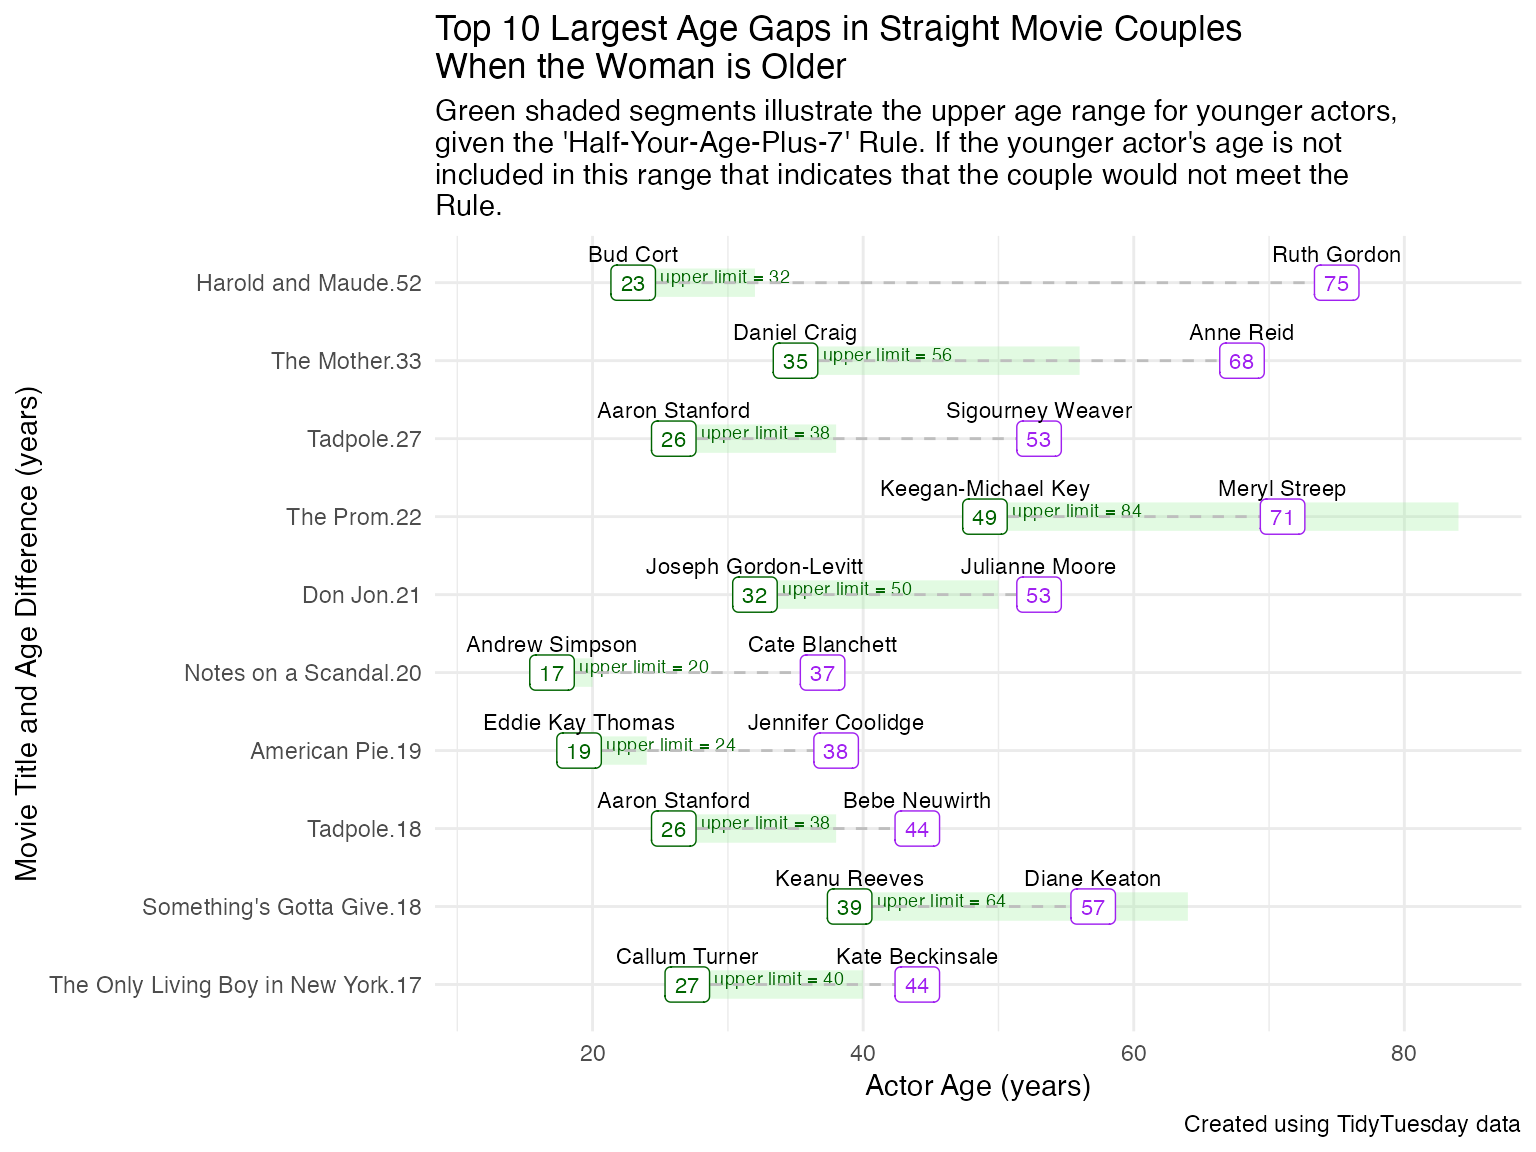
Top 10 Largest Age Gaps when Woman is Older
In the ten largest age gaps when the woman is older, two of men are within the upper age limit produced by the “Half-Your-Age-Plus-7” Rule.
top_age_gaps_long %>%
  filter(older_actor == "woman") %>%
  ggplot(aes(x = age, y = reorder(interaction(movie_name, age_difference), age_difference))) +
  geom_segment(aes(x = age, xend = ifelse(actor == "man_age", age_upperlim, age),
                   y = reorder(interaction(movie_name, age_difference), age_difference), yend = reorder(interaction(movie_name, age_difference), age_difference)),
               color = "lightgreen", alpha = 0.25, linetype = "solid", size = 5) +
  geom_text(data = . %>% filter(actor == "man_age"),
            aes(label = paste("upper limit =", age_upperlim), x = age + 2, y = reorder(interaction(movie_name, age_difference), age_difference)),
            vjust = 0, hjust = 0, size = 2.5, color = "darkgreen") +
  geom_segment(aes(x = age, xend = ifelse(actor == "man_age", age + age_difference, age),
                   y = interaction(movie_name, age_difference), yend = interaction(movie_name, age_difference)),
               color = "gray", linetype = "dashed", linewidth = 0.5) +
  geom_label(aes(label = age, color = actor), show.legend = FALSE,
             fill = "white", size = 3, hjust = 0.5, vjust = 0.5) +
  geom_text(aes(label = actor_name, y = interaction(movie_name, age_difference)),
            vjust = -1.3, hjust = 0.5, size = 3) +
  labs(title = "Top 10 Largest Age Gaps in Straight Movie Couples \nWhen the Woman is Older",
      subtitle = "Green shaded segments illustrate the upper age range for younger actors, \ngiven the 'Half-Your-Age-Plus-7' Rule. If the younger actor's age is not \nincluded in this range that indicates that the couple would not meet the \nRule.",
       x = "Actor Age (years)",
       x = "Actor Age (years)",
       y = "Movie Title and Age Difference (years)",
       caption = "Created using TidyTuesday data") +
  scale_color_manual(values = c("man_age" = "darkgreen", "woman_age" = "purple"),
    labels = c("Man", "Woman")) +
  theme_minimal() +
  theme(legend.position = "top") +
  guides(color = guide_legend(title = "Gender:")) +
  xlim(c(12, 85))