age <- c(18:100)
age_ranges <- t(sapply(age, age_range))
age_df <- data.frame(age = age,
lower_limit = as.numeric(age_ranges[, "lower_limit"]),
upper_limit = as.numeric(age_ranges[, "upper_limit"]))
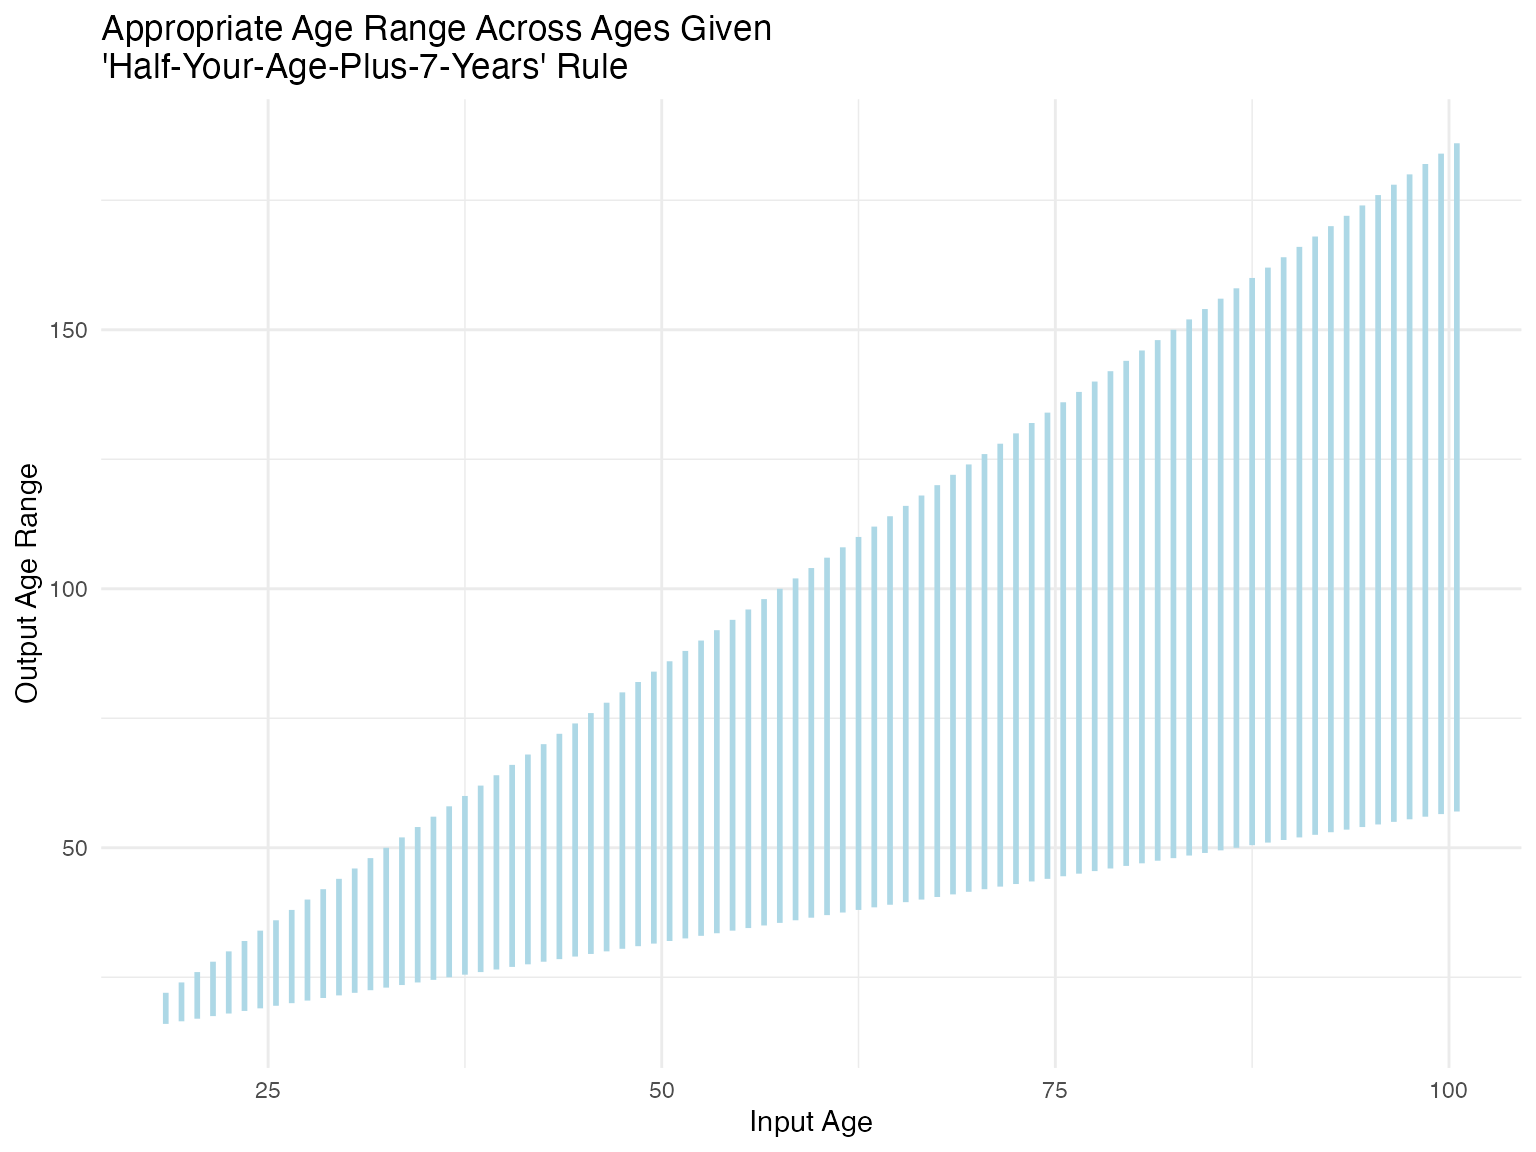
ggplot(age_df, aes(x = age, y = lower_limit)) +
geom_linerange(aes(ymin = lower_limit, ymax = upper_limit), position = position_nudge(x = 0.5), size = 1, color = "lightblue") +
labs(title = "Appropriate Age Range Across Ages Given
'Half-Your-Age-Plus-7-Years' Rule",
x = "Input Age",
y = "Output Age Range") +
theme_minimal()
#> Warning: Using `size` aesthetic for lines was deprecated in ggplot2 3.4.0.
#> ℹ Please use `linewidth` instead.
#> This warning is displayed once every 8 hours.
#> Call `lifecycle::last_lifecycle_warnings()` to see where this warning was
#> generated.