Part 1
Questions:
The question I am to answer with this data analysis is:
How does sugar and caffeine content vary based on the various starbucks drinks on the menu?
Does this sugar content change based on milk type?
Do drinks with the name “skinny” have a significantly lower amount of sugar?
These questions are important to assess if starbucks or certain starbucks drinks are healthy options for individuals.
The original data comes from the official starbucks nutritional dataset the tidytuesday dataset from 12/21/2021. More specifically, this nutritional data is here. I am using data from the tidytuesdayR package, installed from CRAN using install.packages(“tidytuesdayR”), which has removed steamed milk from the original dataset.
The data dictionary is available here.
Part 2: Loading the Data
create_data_directory <- function() {
  data_dir <- "data"

  if (!dir.exists(data_dir)) {
    dir.create(data_dir)
  }
}
create_data_directory()
file_path <- "data/starbucks.csv"
if (!file.exists(file_path)) {
  tuesdata <- tidytuesdayR::tt_load('2021-12-21')
  starbucks <- tuesdata$starbucks
  readr::write_csv(starbucks, file_path)
} else {
  starbucks <- readr::read_csv(file_path)
}
#> Rows: 1147 Columns: 15
#> ── Column specification ────────────────────────────────────────────────────────
#> Delimiter: ","
#> chr  (4): product_name, size, trans_fat_g, fiber_g
#> dbl (11): milk, whip, serv_size_m_l, calories, total_fat_g, saturated_fat_g,...
#>
#> ℹ Use `spec()` to retrieve the full column specification for this data.
#> ℹ Specify the column types or set `show_col_types = FALSE` to quiet this message.
How are sugar and caffeine distributed over different drink types?
ggplot(starbucks, aes(x = sugar_g)) +
  geom_histogram(color = "white", alpha = 0.4, bins = 30) +
  labs(x = "Sugar (g)", y = "Count",
       title = "Distribution of Sugar Content",
       subtitle = "sugar content ranges",
       caption = "Starbucks nutrition data") +
  theme_minimal()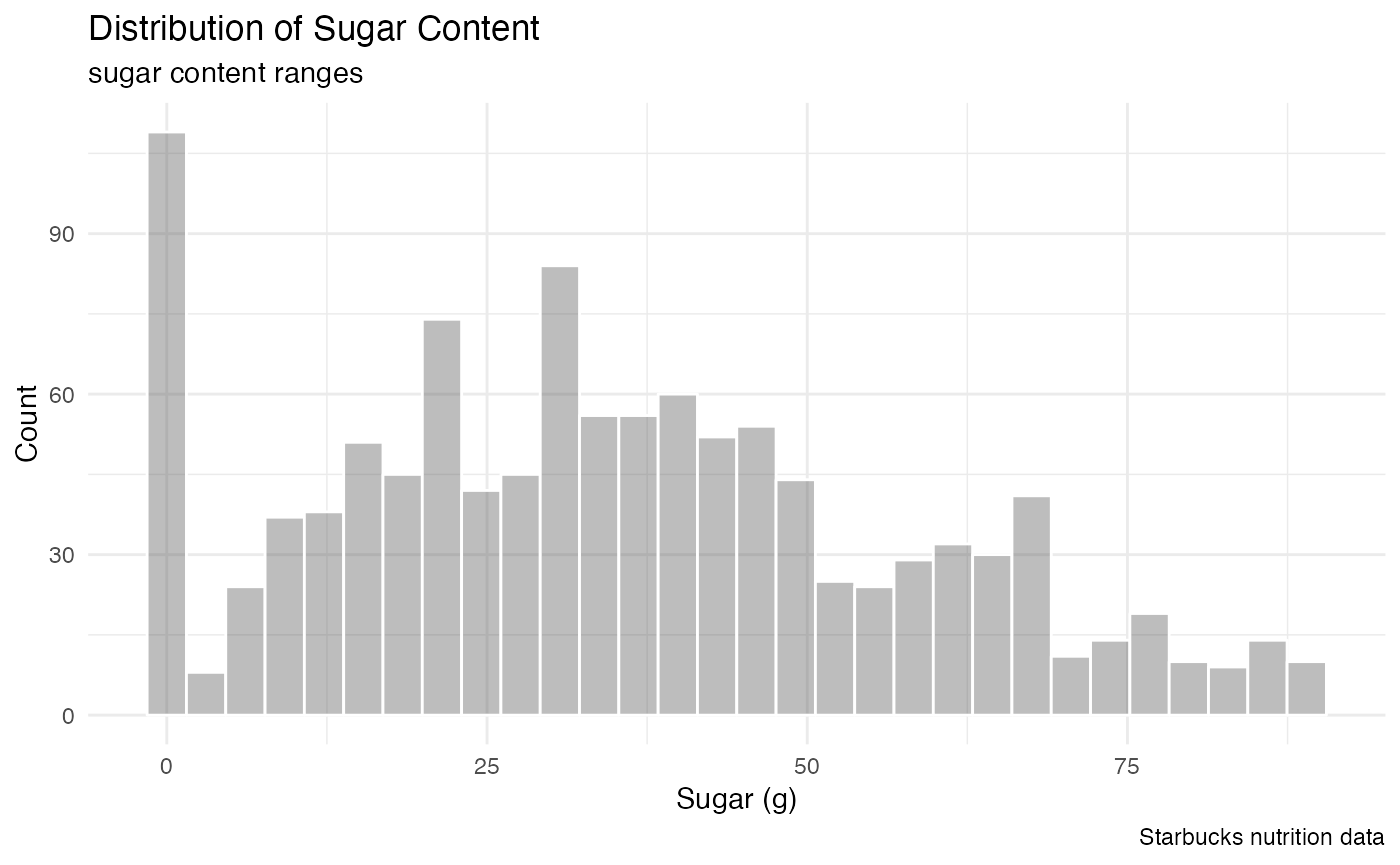
ggplot(starbucks, aes(x = caffeine_mg)) +
geom_histogram(color = "white", alpha = 0.4, bins = 30) +
labs(x = "Caffeine (mg)",
y = "Count",
title = "Distribution of Caffeine Content",
subtitle = "caffeien content ranges",
caption = "Starbucks nutrition data") +
theme_minimal()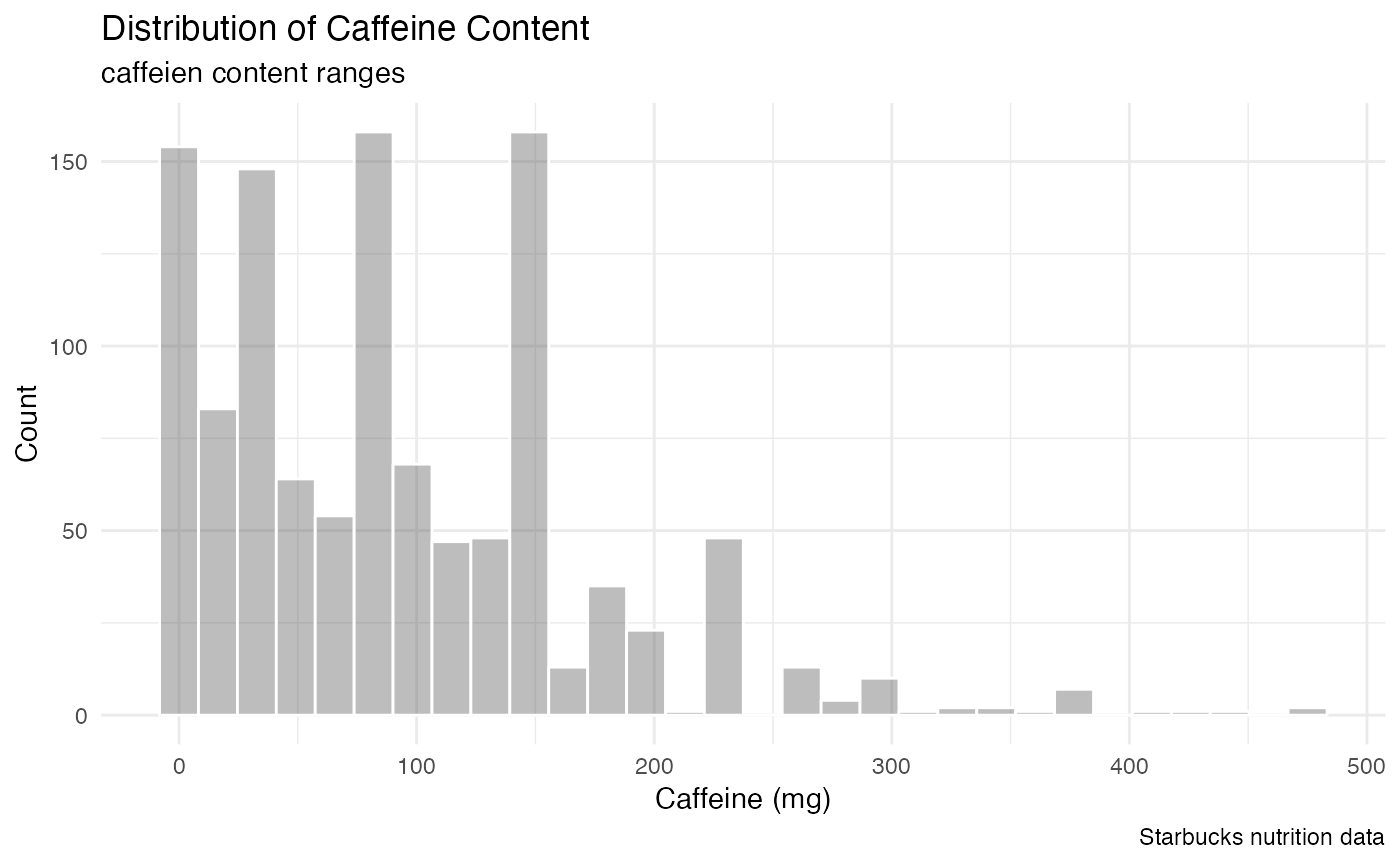 Sugar is more uniformly distributed, while caffeiene ranges are high
Does sugar content change based on milk type?
This will reveal if milk is what may be contributing to the high sugar content in starbucks drinks, or if other factors (syrups, added sugar, etc are)
starbucks %>% group_by(milk) %>% summarise(sugar_average = mean(sugar_g)) %>% ggplot(aes(x = milk, y = sugar_average, fill = milk)) +
  geom_point() +
  geom_line()+
  labs(title = "Average Sugar Content by Milk Type",
       subtitle = "line graph showing change in sugar based on milk type",
       caption = "Data is from starbucks nutritional information",
       x = "Milk Type",
       y = "Average Sugar Content (g)") +
  theme_minimal()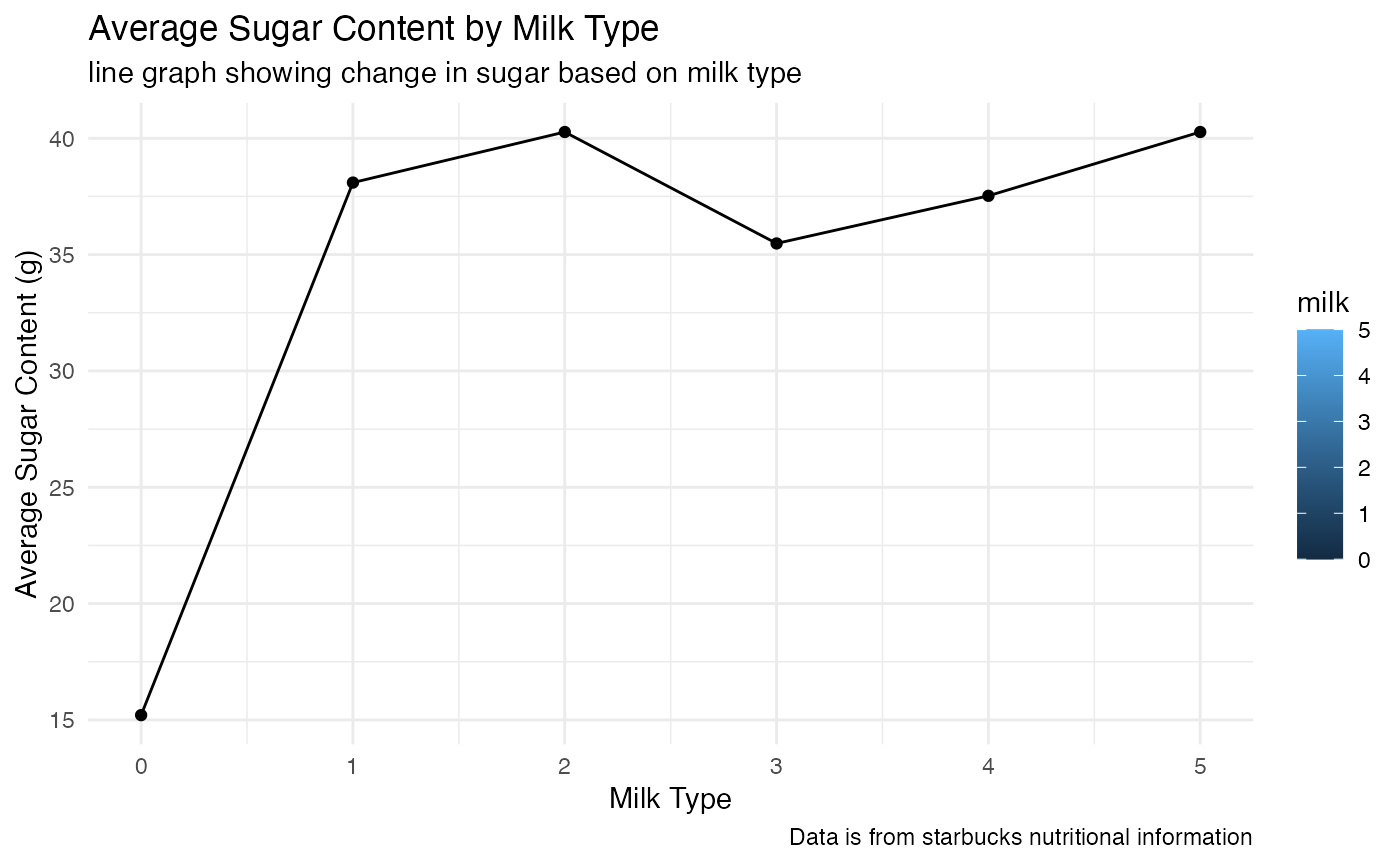
ggplot(starbucks, aes(x = milk, y = sugar_g, fill =  factor(milk))) +
    geom_rain(rain.side = 'l')+
  labs(title = "Sugar Content by Milk Type",
       subtitle = "rain plot showing change in sugar based on milk type",
       caption = "Data is from starbucks nutritional information",
       x = "Milk Type",
       y = "Sugar Content (g)",
       fill = "Milk Type")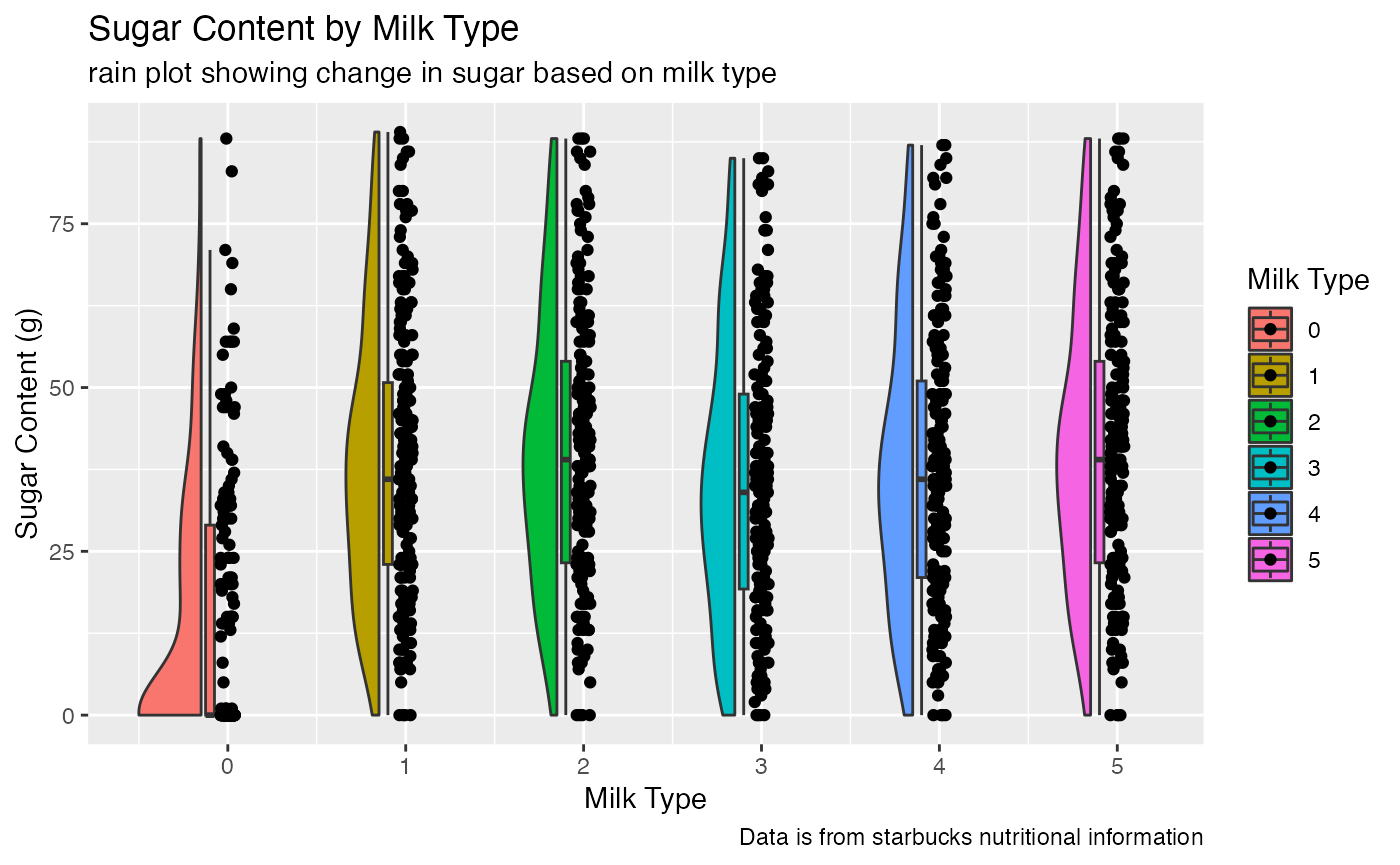
# 0 is no milk, 1 is nonfat, 2 is 2%, 3 is soy, 4 is coconut, and 5 is whole milk
# We see that despite using different milk type, the average sugar content for drinks with specific milk types (aside from no milk) are all relatively close to one another. Thus, we can not assume that milk contributes in high sugar content, but need to assess this further by considering other factors or more rigorous testing.

# without taking the average of all drinks with a certain milk, here I am looking at each drink type (average) and individually facetted by milk type to get a better sense of the distribution
# We see event with no milk (0), some drinks still have moderate sugar content but more testing would be needed.
0 is no milk, 1 is nonfat, 2 is 2%, 3 is soy, 4 is coconut, and 5 is whole milk We see that despite using different milk type, the average sugar content for drinks with specific milk types (aside from no milk) are all relatively close to one another. Thus, we can not assume that milk contributes in high sugar content, but need to assess this further by considering other factors or more rigorous testing.
Without taking the average of all drinks with a certain milk, here I am looking at each drink type (average) and individually facetted by milk type to get a better sense of the distribution We see event with no milk (0), some drinks still have moderate sugar content but more testing would be needed.
Do drinks named “skinny” have an average lower sugar and calorie count compared to other drinks?
#To use purrr functions (i know there is an easier way)
mean_function <- function(data) {
  summarise(data, mean_sugar = mean(sugar_g), count = n())
  }
starbucks %>%
  mutate(group = ifelse(grepl("skinny", product_name, ignore.case = TRUE), "Skinny", "Regular")) %>%
  group_split(group) %>%
  map_df(~ mean_function(.x) %>% mutate(group = unique(.x$group))) %>%
  ggplot(aes(x = group, y = mean_sugar, fill = group)) +
  geom_col(position = "dodge", width = 0.7, stat = "identity") +
  geom_errorbar(aes(ymin = mean_sugar - sd(mean_sugar) / sqrt(count),
                    ymax = mean_sugar + sd(mean_sugar) / sqrt(count)),
                position = position_dodge(width = 0.7), width = 0.25) +
  facet_grid(~ group, scales = "free") +
  labs(title = "Sugar Content Comparison: Skinny vs Regular",
       subtitle = "Plotplot showing the distribution of sugar content",
       x = "Group",
       y = "Mean Sugar Content (g)")
#> Warning in geom_col(position = "dodge", width = 0.7, stat = "identity"):
#> Ignoring unknown parameters: `stat`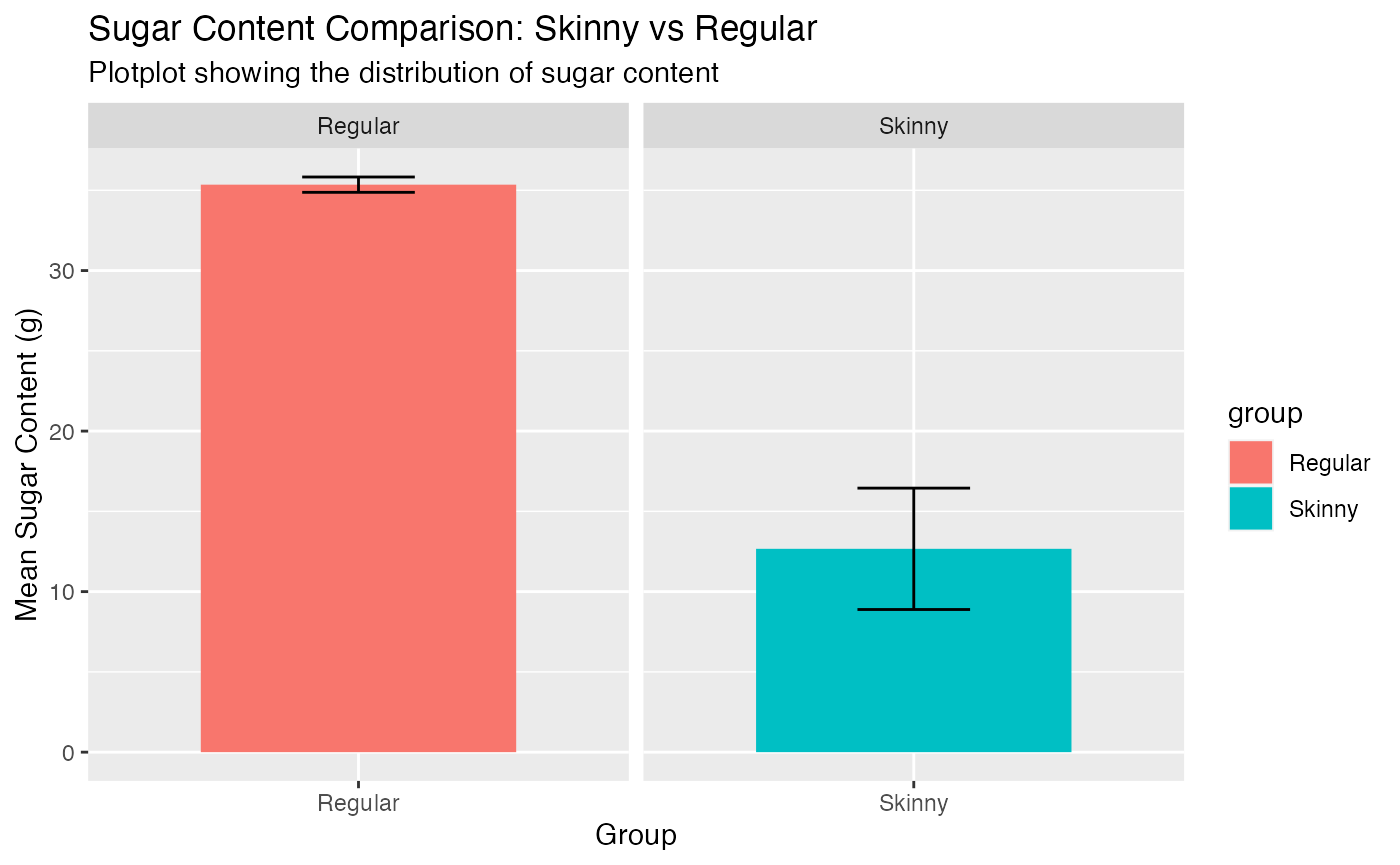
We see that the skinny drinks clearly have a lower sugar average compared to other drinks. However, it is important to note that there are only 18 skinny while the rest (1129) of the drinks are classified as regular. This definitely plays a role and further analysis of a smaller group of the regular drinks could be assessed.
Summary:
Overall, sugar and caffeine amounts vary for different drinks. However, milk type may play a role in increasing sugar amounts in these drinks. More assessment on other factors should first be considered, such as syrups, flaorings, etc. Drinks labelled as “skinny” also have a lower sugar concentration in comparison to all other drinks, but more assesment of what exactly the “skinny” drinks consist of could be important in properly understanding.